
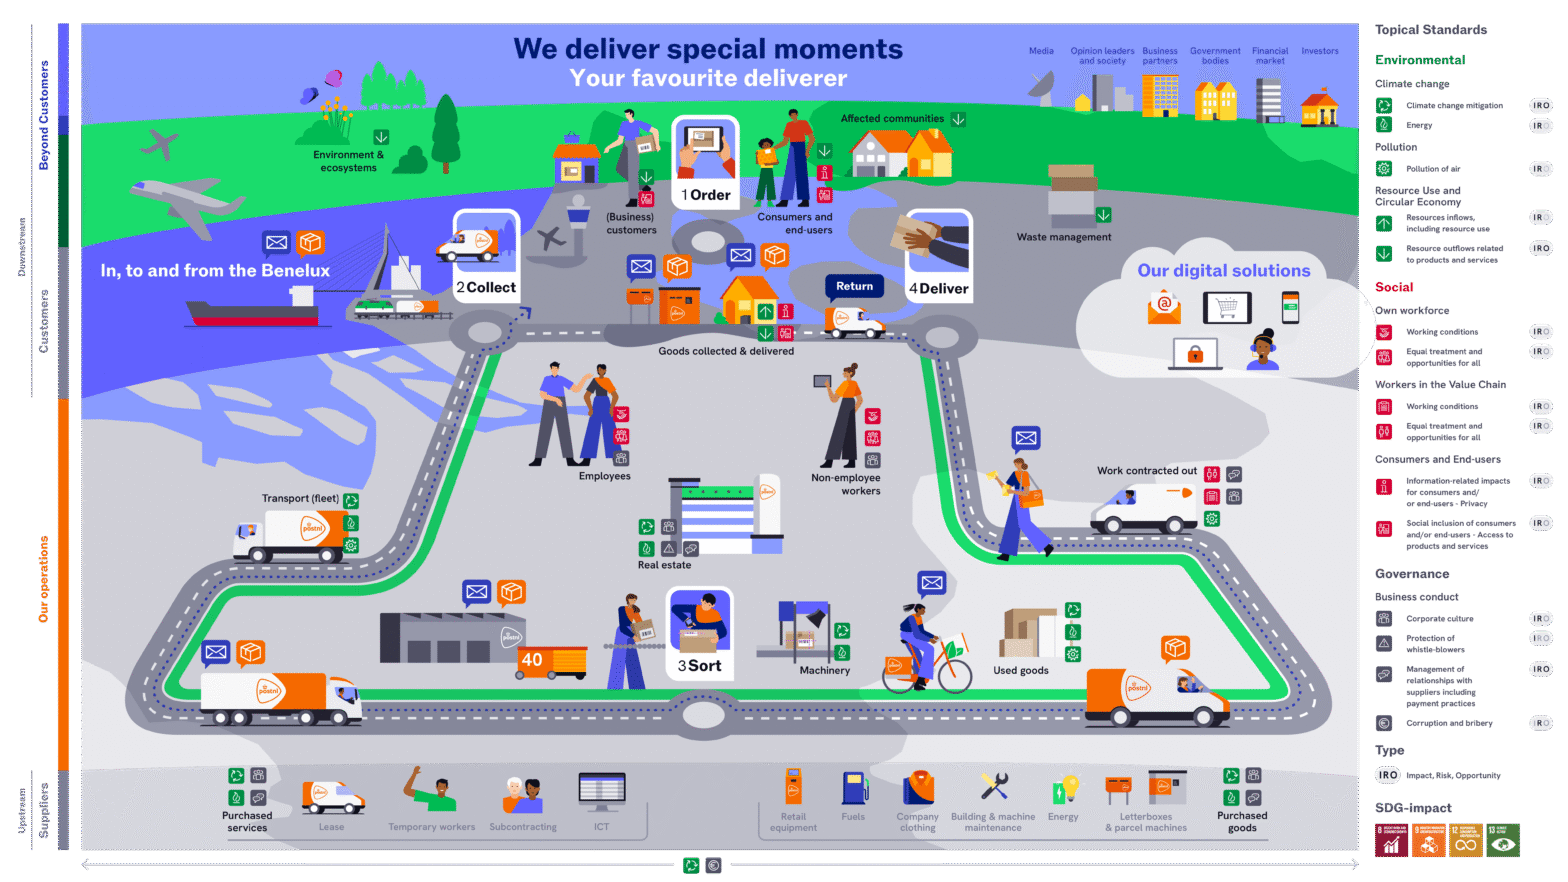
PostNL value chain: complex interrelationships clearly explained in one infographic
In PostNL’s 2024 annual report, one visual immediately stands out: the value chain, which provides a single overview of how PostNL interacts with its suppliers (upstream), customers (downstream), and other stakeholders. In line with CSRD, the ESG impacts, risks, and opportunities at play at these intersections have been clearly mapped out.
Mattmo developed this infographic in close collaboration with PostNL as part of its annual report production. However, the infographic is designed to be used in conversations with job applicants, the press, financiers, and other stakeholders to clarify how PostNL’s value chain is structured.
A complex assignment: mapping the value chain
Visualizing a value chain is not a simple task. The infographic must convey several things:
- PostNL’s upstream value chain, including hiring of personnel, deployment of transport assets, data, and partnerships.
- PostNL’s own operations and processes, traditional mail, parcels, and e-commerce. These are offered both physically and increasingly digitally and via the cloud.
- The downstream value chain with PostNL’s customers and ‘beyond customers’, but also other stakeholders, including shareholders and society.
All these elements had to be recognizable, coherent, and visible in the correct order — without overwhelming the reader with complexity. The metaphor of a road was chosen to effectively visualize all relevant items.


“We were looking for a way to visualize in a single coherent image how our value chain relates to the impacts, risks, and opportunities we identified from our dual materiality analysis. Mattmo assembled a multidisciplinary team consisting of a sustainability expert, communications strategist, and designer, and in a number of sessions, we managed to translate that abstract story into a visual that makes it understandable and recognizable to our stakeholders.”
– Willem Wassink
Why this infographic works so well
Why this infographic works so well
What makes this infographic special is the combination of simplicity and completeness.
With a smart layered structure, it is clearly displayed:
- Which sources and resources form the basis
- How PostNL’s core activities add value
- What outcomes and effects that produces, both financial and societal
Thanks to visual hierarchy, use of color, and clear iconography, the infographic is intuitively readable. At a glance, it becomes clear how PostNL interacts with its suppliers, customers, and other stakeholders — from mail and parcel delivery, e-commerce, and digital services to social engagement and sustainability.
From strategic themes to societal impact
The infographic maps not only the logistics chain, but also broader themes such as:
- Sustainability (for example CO₂ reduction and sustainable urban logistics)
- Digital transformation
- Customer focus and innovation
- Responsible employership and diversity
In this way, the picture bridges the gap between operational activities and strategic ambitions, something that is precisely lacking in many traditional annual reports.
The power of visual storytelling in annual reports
More and more organizations want to not only present data in their reporting, but also tell their story visually.
Infographics like this value creation map make complex strategies accessible to a broad audience: from investors and analysts to employees and societal stakeholders.
At Mattmo we believe that good visual storytelling is indispensable in modern corporate communication. A strong infographic makes connections visible, invites depth and increases involvement with the content.
Make your strategy visible at a glance?
Would you like to visualize your strategy, value creation, and impact clearly and attractively, just like PostNL?
At Mattmo Creative, we support organizations in developing powerful infographics, visual annual reports, and impact communication that make strategy and societal value tangible.
📖 View the PostNL value chain in the 2024 annual report here: PostNL value chain infographic
Would you also like to work on a visually strong and strategically clear report? Contact us. Together, we make your impact visible.

